What Does Your Engineering Actually Cost Per Commit?
Levi Garner
Founder & CTO, InteliG
TLDR: We scanned Vercel’s GitHub org — $300K annual team cost, 157 commits, $1,910 per commit. Your CFO tracks cost per customer — you should track cost per commit. Calculate yours → intelig.ai/tools/cost-estimator
Your CFO can tell you the cost to acquire a customer down to the penny.
Your VP of Sales knows cost per lead, cost per meeting, cost per demo.
Ask your CTO what a commit costs and you’ll get a blank stare.
Engineering is the biggest line item nobody measures
At most tech companies, engineering is 40-60% of total operating expenses. Salaries, benefits, tooling, infrastructure. It’s the largest investment the company makes.
And the unit economics of that investment? Completely invisible.
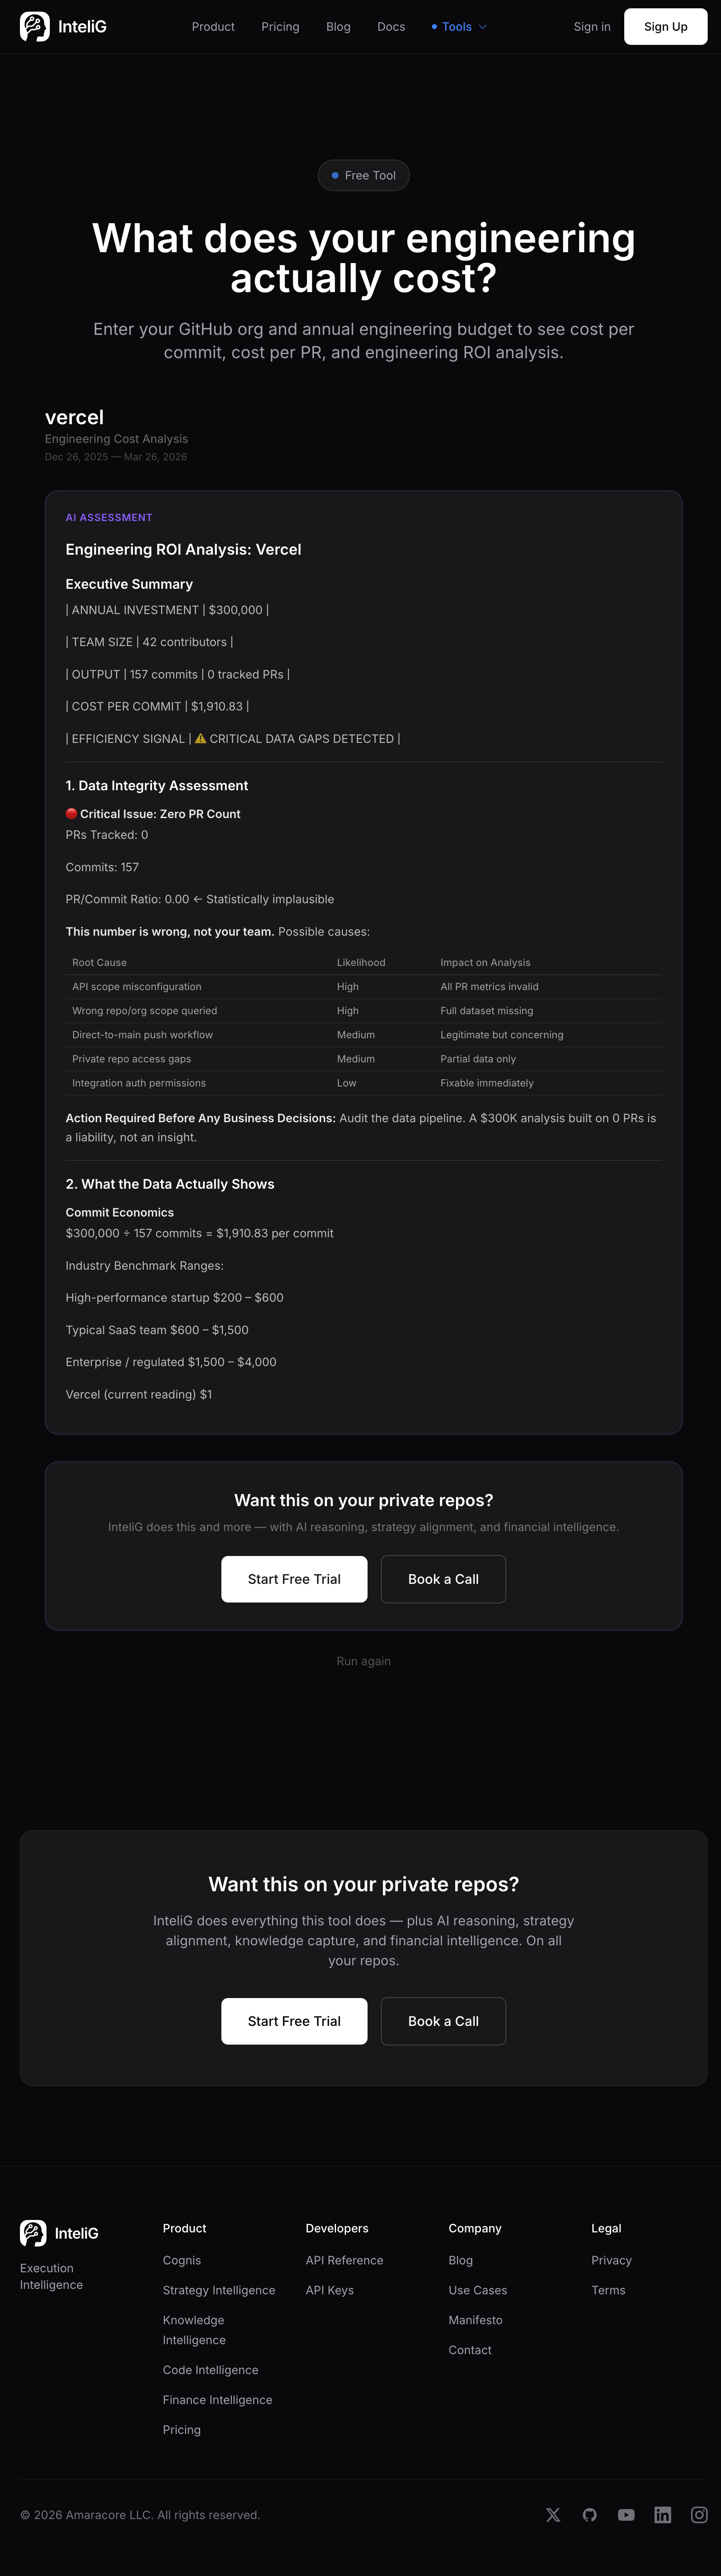
We pointed our Engineering Cost Estimator at Vercel — 42 contributors, 157 commits over 90 days, $300K estimated annual team cost. The result: $1,910.83 per commit.
The tool also benchmarked it against industry ranges: high-performance startups run $200-600 per commit, typical SaaS teams $600-1,500, enterprise $1,500-4,000. Vercel landed at $1,910 — not alarming, but visible. That’s the kind of data point that makes CFOs very uncomfortable.
Not because it’s high. Because nobody ever calculated it before.
Why cost per commit matters
I’m not suggesting you evaluate engineers by how many commits they push. That would be idiotic. A single commit that fixes a critical security vulnerability is worth more than a thousand formatting changes.
But cost per commit as an organizational metric tells you something important: how efficiently your engineering investment converts into shipped work.
It’s a proxy for engineering leverage. If your cost per commit is trending up quarter over quarter, something is wrong. More meetings. More overhead. More process. More engineers sitting in planning sessions instead of writing code.
If it’s trending down, your team is getting more efficient. Better tooling. Less friction. More focused time.
The absolute number matters less than the trend.
What most CTOs present to the board
Slide deck. Jira burndown charts. Story points completed. “We shipped 47 features this quarter.”
None of that connects to dollars. The board nods, moves on, and secretly wonders if the engineering team is actually productive or just busy.
Now imagine presenting this instead:
“Our cost per commit decreased 18% this quarter. Engineering leverage is improving. Here’s the breakdown by team, and here’s what drove the improvement.”
That’s a language the board understands. That’s finance-grade engineering data.
What the estimator calculates
Enter any public GitHub org and an average salary figure. The tool analyzes commit history across all repositories and produces:
- Cost per commit — total estimated engineering cost divided by commit output
- Cost per active contributor — how your investment distributes across the team
- Industry benchmarks — where your number falls relative to startup, SaaS, and enterprise ranges
- AI analysis — Cognis identifies data gaps, efficiency signals, and specific recommendations
It’s a model, not an accounting audit. But it’s a model based on real commit data, not story point estimates or self-reported time tracking.
The uncomfortable truth
Most engineering orgs are spending $200K+ per engineer per year (fully loaded) and have zero unit economics on that investment.
No other department operates this way. Marketing knows their CAC. Sales knows their cost per opportunity. Support knows their cost per ticket.
Engineering? “Trust us, we’re building stuff.”
That worked when software teams were 5 people. It doesn’t work when engineering is a $20M annual budget.
Start with the baseline
You can’t improve what you don’t measure. Cost per commit gives you a baseline. From there, you can track trends, compare teams, identify friction, and make the engineering investment legible to the rest of the business.
It takes 60 seconds. One GitHub org URL. One salary number.
See What Your Engineering Org Is Really Doing
InteliG reads your repos, analyzes every commit, and gives you the execution intelligence CTOs actually need.
Start Your Trial