Is Your Engineering Team ELITE? A DORA Benchmark in 60 Seconds
Levi Garner
Founder & CTO, InteliG
TLDR: Vercel scored DORA ELITE — 0.0 day median cycle time, 90.9% merge rate. Most teams don’t know where they land. Now you can check in 60 seconds. Benchmark yours → intelig.ai/tools/pr-benchmark
DORA is the most widely cited engineering performance framework in the industry. Four categories: Elite, High, Medium, Low. Based on deployment frequency, lead time, change failure rate, and recovery time.
Most CTOs know about DORA. Almost none of them know where their team actually falls.
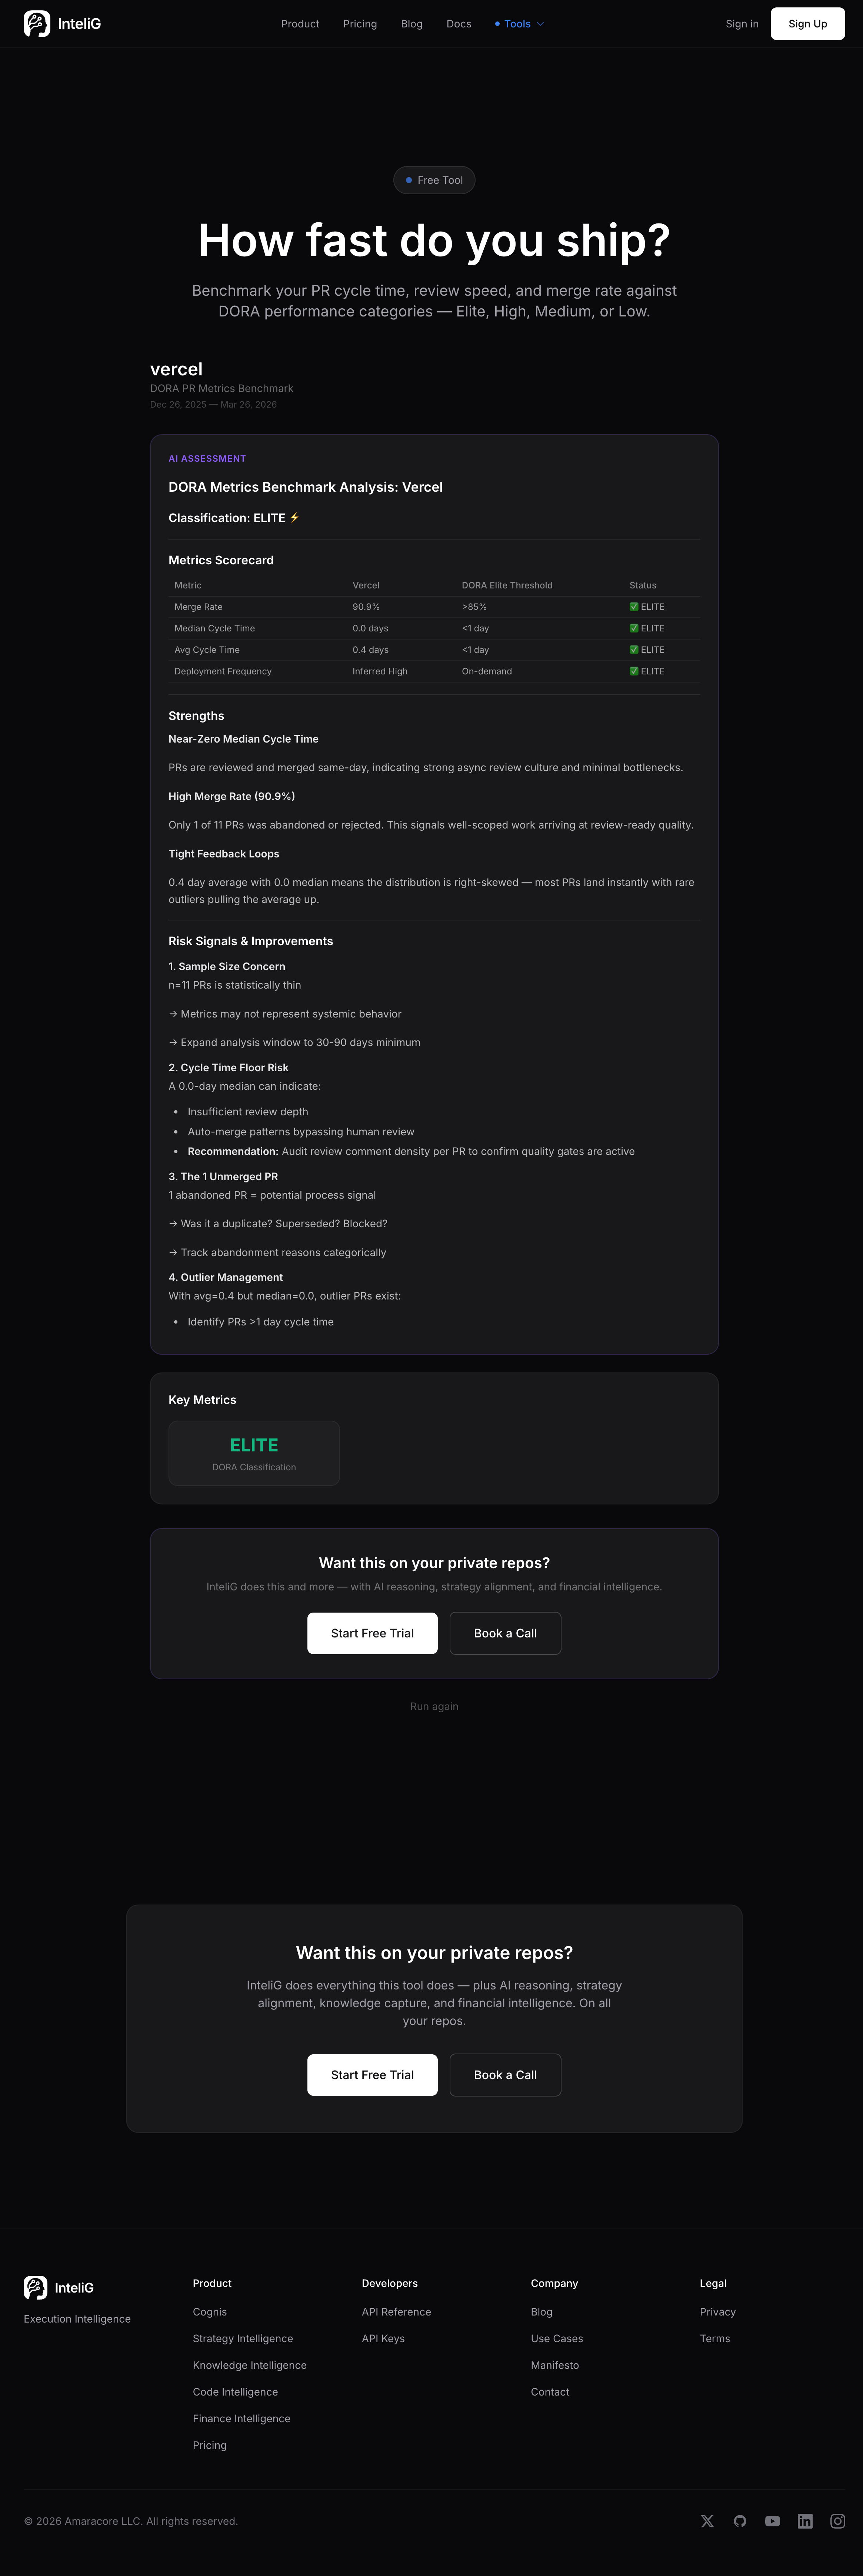
Vercel is ELITE
We ran Vercel through our PR Cycle Time Benchmark. The results:
| Metric | Vercel | DORA Elite Threshold |
|---|---|---|
| Merge Rate | 90.9% | >85% |
| Median Cycle Time | 0.0 days | <1 day |
| Avg Cycle Time | 0.4 days | <1 day |
| Deployment Frequency | Inferred High | On-demand |
ELITE across the board. That’s what a well-oiled engineering org looks like in the data.
Why most teams don’t measure this
DORA benchmarking traditionally requires setting up a metrics pipeline — instrument your CI/CD, tag deployments, calculate lead times, aggregate over weeks. Most teams never get around to it.
Our tool does it from GitHub data alone. No instrumentation. No CI/CD integration. Just commit and PR patterns from the public API.
Is it a perfect DORA assessment? No — deployment frequency and change failure rate need production monitoring data. But cycle time and merge rate are directly measurable from PR data, and they’re the two metrics that correlate most strongly with engineering performance.
What each classification means
ELITE: Sub-day cycle times, high merge rates, consistent shipping. These teams have minimal friction between writing code and landing it.
HIGH: Cycle times under a day, good merge rates. Strong teams that might have occasional bottlenecks in review.
MEDIUM: Cycle times under a week. Reviews are happening but slowly. Process overhead is visible.
LOW: Cycle times over a week. Something is structurally wrong — too much process, unclear ownership, or review bottlenecks.
The uncomfortable middle
Most teams land in MEDIUM. Not broken enough to trigger alarm, not fast enough to be competitive. The dangerous middle where “it’s fine” becomes the enemy of “it could be great.”
The difference between MEDIUM and HIGH is usually not talent — it’s friction. Review turnaround time. CI pipeline speed. Unclear code ownership. Fix those, and cycle time drops.
What the benchmark shows you
The tool produces a full metrics scorecard with your numbers mapped against DORA thresholds. Plus an AI analysis that identifies:
- Strengths — what’s working in your PR workflow
- Risk signals — sample size concerns, outlier patterns, process gaps
- Specific recommendations — actionable improvements based on your data
Vercel’s analysis highlighted their near-zero median with a 0.4 day average, noting that “rare outliers are pulling the average up” — meaning most PRs land instantly but a few take longer. That’s a healthy pattern.
Check your classification
The entire benchmark takes 60 seconds. One GitHub org URL.
You’ll either confirm what you suspected — or discover you’re not as fast as you thought.
See What Your Engineering Org Is Really Doing
InteliG reads your repos, analyzes every commit, and gives you the execution intelligence CTOs actually need.
Start Your Trial