I Asked Cognis: What Was My Most Impactful Commit This Week?
Levi Garner
Founder & CTO, InteliG
TLDR: I asked Cognis “What was the most impactful commit this week?” It didn’t just find it — it scored every commit on quality × complexity × business value, built a comparison table, identified the bigger pattern across my org, and gave me a specific recommendation. This is what engineering intelligence actually looks like.
The Question
One question. That’s all I typed:
“What was the most impactful commit this week?”
Any CTO has asked some version of this. What shipped? What actually mattered? Was it the 50-file refactor or the 3-line fix that unblocked production?
You can’t answer this with Jira. You can’t answer it with a standup. You can’t even answer it by reading Git logs — there are too many commits, too much context to hold in your head.
So I asked Cognis.
What Cognis Returned
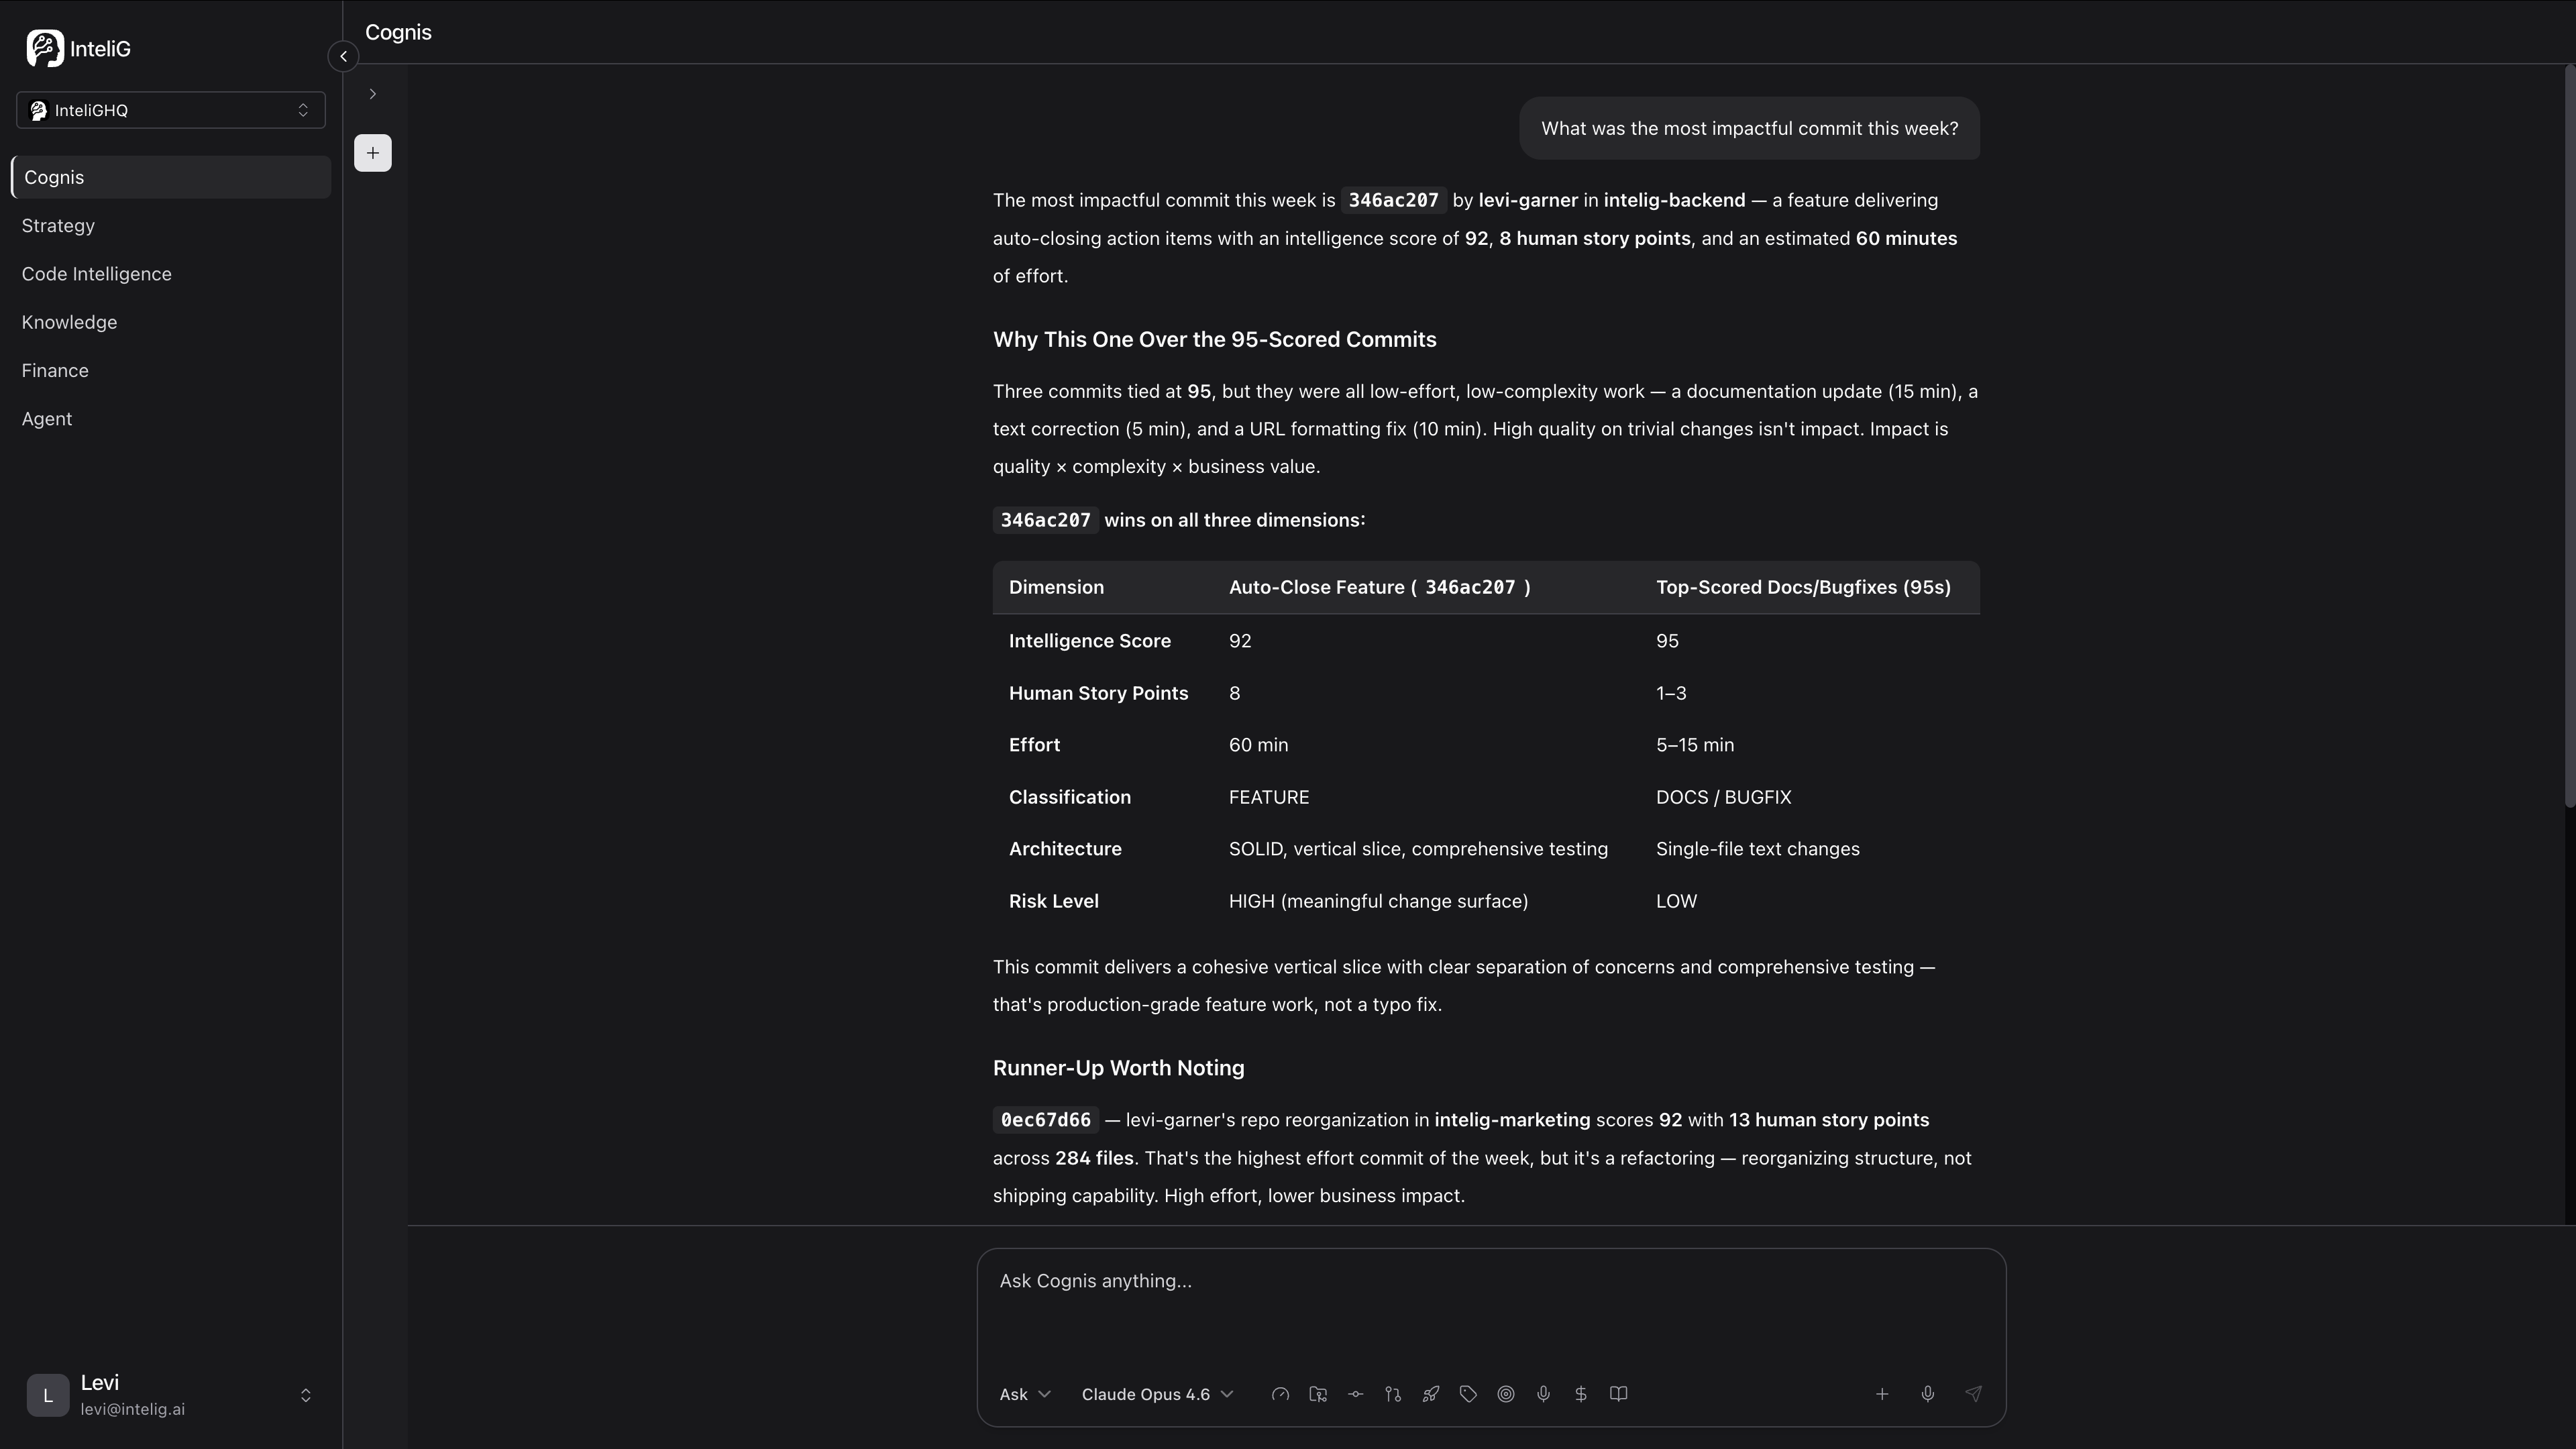
Cognis identified commit 346ac287 — a feature delivering auto-closing action items — with an intelligence score of 92, 8 human story points, and an estimated 60 minutes of effort.
Then it did something no dashboard can do. It explained why this commit won:
“Impact is quality × complexity × business value. This commit delivers a cohesive vertical slice with clear separation of concerns and comprehensive testing — that’s production-grade feature work, not a typo fix.”
It built a comparison table: the winning commit vs the next-best scored commits, breaking down intelligence score, story points, effort, classification, architecture, and risk level.
The Bigger Pattern
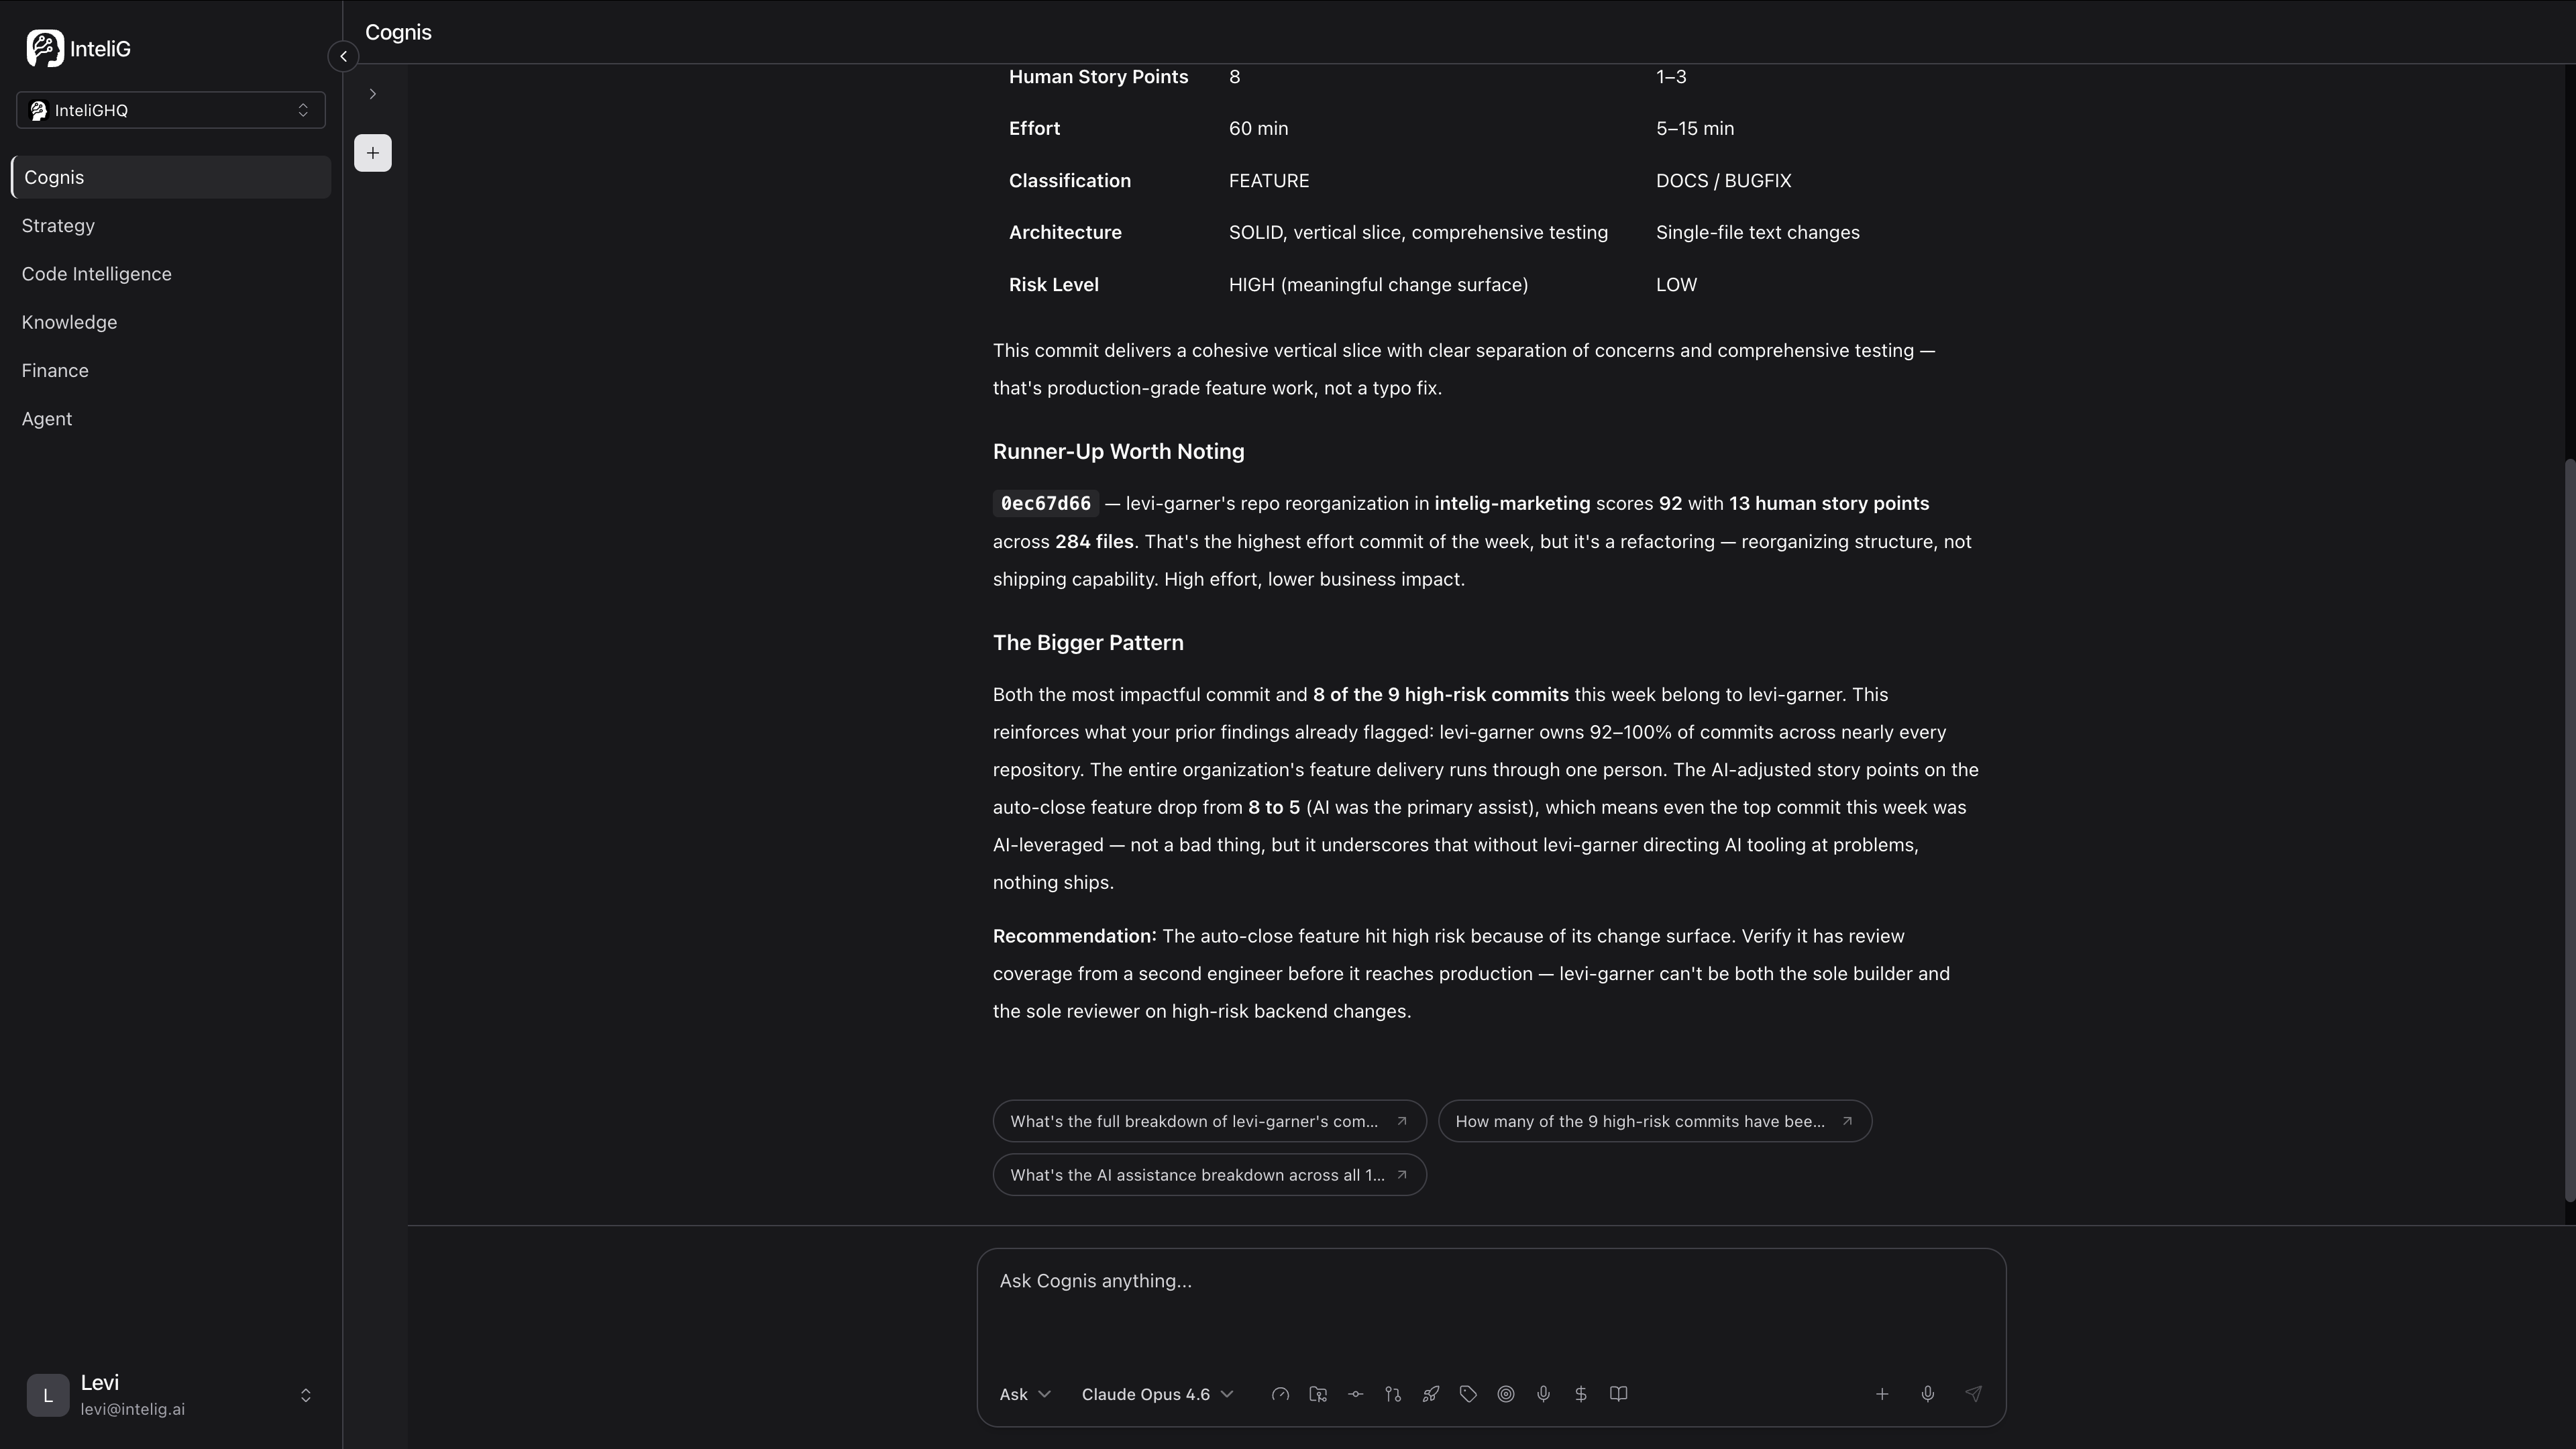
This is where it gets interesting. Cognis didn’t stop at answering the question. It identified a pattern:
- 8 of the 9 high-risk commits this week belong to one contributor
- That contributor owns 92-100% of commits across nearly every repository
- The top commit was AI-leveraged — AI was the primary assist
- Without that contributor directing AI tooling at problems, nothing ships
Then it gave me a specific recommendation: verify the auto-close feature has review coverage from a second engineer before production, because the contributor can’t be both the sole builder and the sole reviewer on high-risk backend changes.
That’s not a metric. That’s not a chart. That’s intelligence.
Why This Matters
Every engineering analytics tool on the market would have shown me a commit count. Maybe a PR cycle time. Maybe a DORA metric.
None of them would have:
- Scored the commit on a multi-dimensional quality framework
- Compared it against every other commit that week
- Identified a concentration risk pattern across the entire org
- Recommended a specific action to mitigate that risk
This is the difference between a dashboard and a reasoning engine.
Dashboards show you the past. Cognis reasons about it.
Try It
Connect GitHub. Ask Cognis anything. Get an answer backed by every commit, PR, and deployment in your org — not opinions, not tickets, not self-reported status updates.
See What Your Engineering Org Is Really Doing
InteliG reads your repos, analyzes every commit, and gives you the execution intelligence CTOs actually need.
Start Your Trial