Engineering Velocity Is Not Lines of Code
Levi Garner
Founder & CTO, InteliG
TLDR: Vercel’s velocity is STABLE at 12.1 commits/week over 13 weeks — but the data reveals a clear oscillating rhythm of surge and trough weeks. That pattern matters more than the number. Track yours → intelig.ai/tools/velocity
Everyone measures velocity wrong.
Lines of code. Story points completed. Tickets closed. PRs merged. Pick your vanity metric — they all have the same problem: they measure activity, not momentum.
What velocity actually tells you
Velocity is a trend, not a number. It answers one question: is your engineering org accelerating, decelerating, or holding steady?
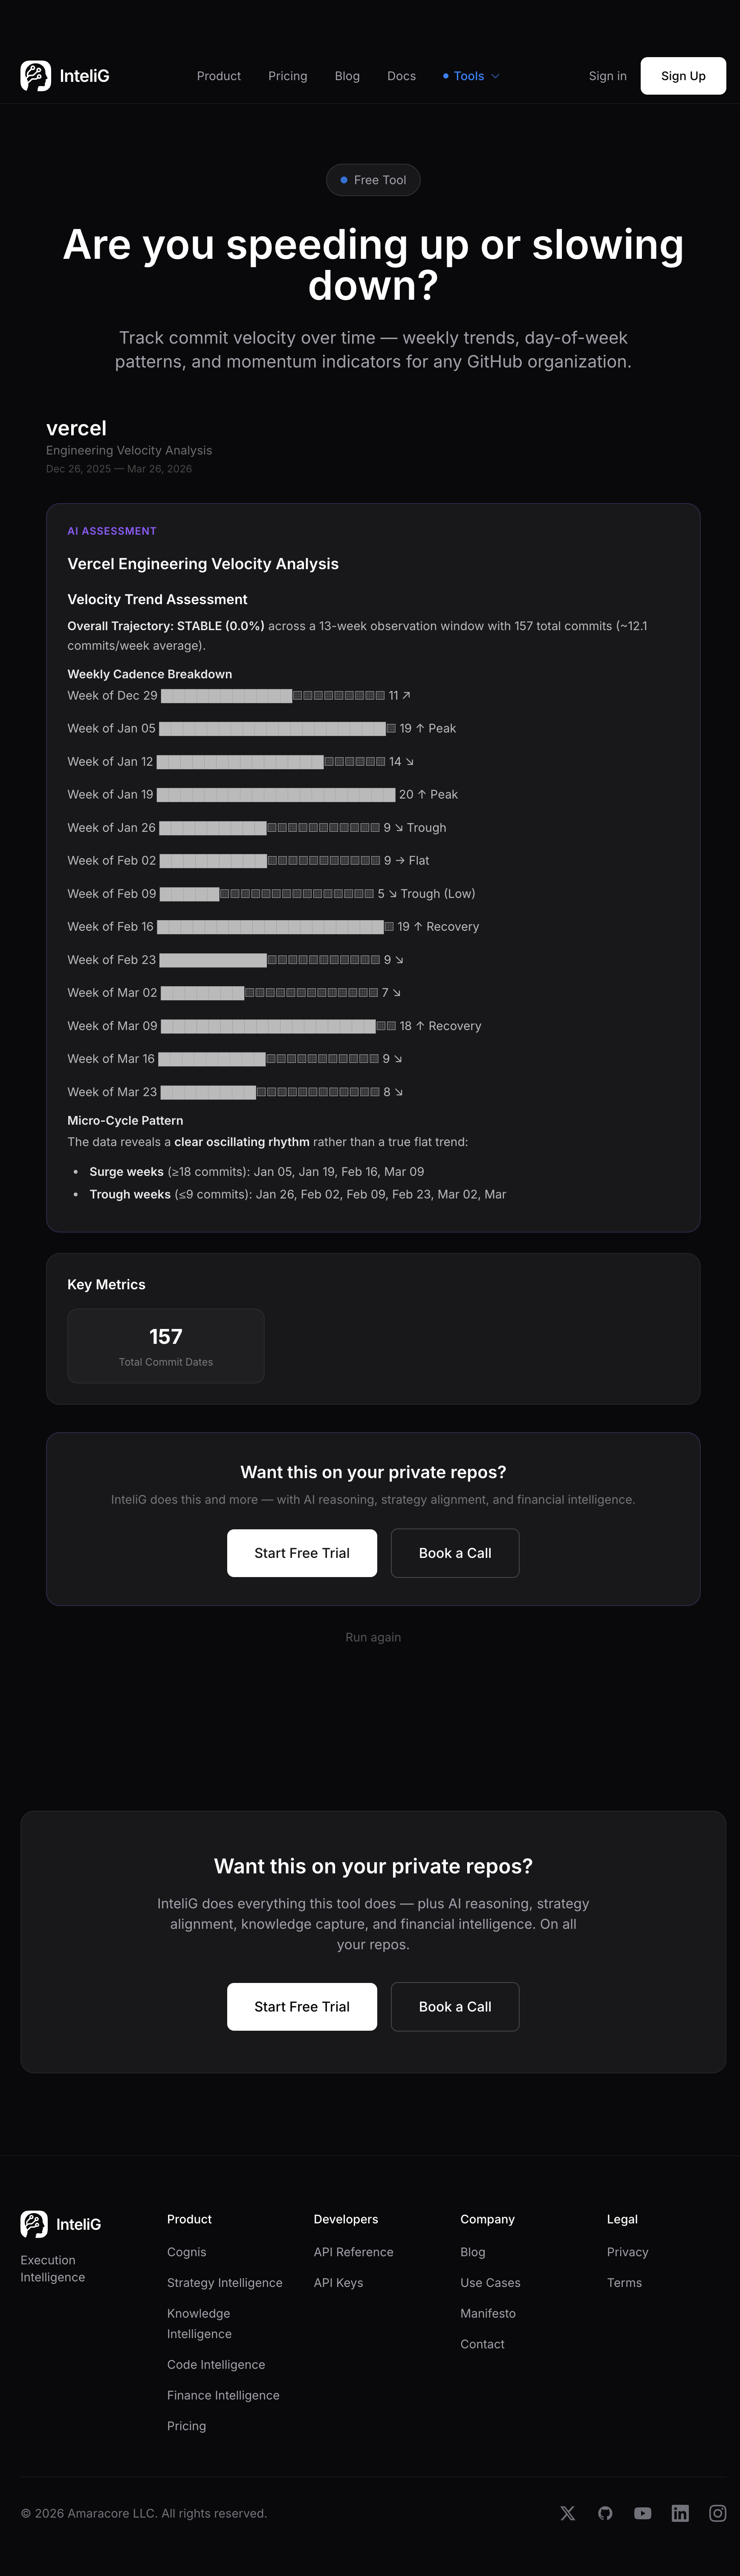
We tracked Vercel’s commit velocity over 13 weeks. The headline: STABLE at 0.0% change, averaging 12.1 commits per week. That sounds boring until you look at the pattern.
The oscillating rhythm
The data reveals something the headline number hides: a clear oscillating pattern of surge and trough weeks.
Surge weeks (18+ commits): Jan 5, Jan 19, Feb 16, Mar 9. Trough weeks (9 or fewer commits): Jan 26, Feb 2, Feb 9, Feb 23, Mar 2.
This isn’t noise. It’s a rhythm. Two weeks of intense shipping followed by a quieter week of planning, review, or recovery. Then another burst.
For Vercel, this is likely healthy — it maps to a sprint cadence or a deliberate build/ship cycle. The key insight is that the troughs aren’t getting deeper and the surges aren’t getting shorter. The oscillation is stable.
When the pattern is a problem
A healthy oscillation looks like Vercel’s: consistent amplitude, no downward trend. Unhealthy patterns include:
Declining peaks. Each surge is smaller than the last. The team is losing momentum. Usually means attrition, growing technical debt, or increasing process overhead.
Widening troughs. Quiet weeks getting quieter and longer. The team is spending more time not shipping. Investigate: meetings, planning overhead, blocked PRs, context switching.
Single spikes. One massive week followed by weeks of nothing. This is crunch-and-crash. Unsustainable. The team ships everything at once (usually before a deadline) and then recovers.
Weekend patterns. Consistent weekend commits mean either a distributed global team (healthy) or engineers working off-hours to meet deadlines (not healthy). The tool breaks this down.
What the tracker shows you
Paste any GitHub org URL. You get:
- 13-week velocity trend — commits per week with direction indicator
- Weekly cadence breakdown — each week labeled as Peak, Trough, Recovery, or Flat
- Surge and trough identification — specific weeks called out with commit counts
- AI analysis — pattern classification, sustainability assessment, and specific observations about your team’s rhythm
The AI doesn’t just chart the data. It interprets it. For Vercel, it identified the oscillating rhythm as deliberate and sustainable. For your org, it might identify something different.
The metric that matters
Stop tracking lines of code. Stop celebrating commit counts. Start tracking the shape of your velocity curve.
A team shipping 50 commits per week in a declining trend is in worse shape than a team shipping 15 per week in a stable or ascending pattern. The trend is the signal. The absolute number is noise.
See What Your Engineering Org Is Really Doing
InteliG reads your repos, analyzes every commit, and gives you the execution intelligence CTOs actually need.
Start Your Trial